While it is well known in the Python scientific computing community, Jupyter is in fact a language-agnostic development environment. High-quality language kernels exist for the main languages of data sciences, such as Python, C++, R or Julia. But another important tool for data science is the SQL family of programming languages. Today, we announce the release of a Jupyter kernel for SQLite.
This new kernel allows the user to use the complete SQLite syntax as well as some extra operations such as opening or closing a database file, or visualizing the data in different ways using Jupyter magics.
HTML and Text table visualizations for different Jupyter interfaces
To make the task of implementing a new Kernel for Jupyter easier, we make use of Xeus, a library providing a solid implementation ofthe Jupyter kernel protocol, so that we can focus on implementing the language-specific parts of the kernel.
As a connection between SQLite’s native C implementation and C++ we’re using SRombauts’ library SQLiteCpp.
Current state
xeus-SQLite is still under active development but it offers a fully functional SQLite interface and magics to perform higher-level operations that are outside of the scope of the SQL syntax, such as creating, opening, or closing SQLite databases. Some of the things you can do with xeus-SQLite are creating a new database, loading it, backing it up or deleting it. You can also check if a table exists, set and reset keys of a database and get information about it. You can find more about the use of these methods in SQLite’s documentation.
xeus-SQLite provides rich HTML display of tables in the Jupyter Notebook and Jupyter Lab. For the Jupyter Console we make use of the tabulate library for textual display.
Different commands being executed on xeus-SQLite
The future
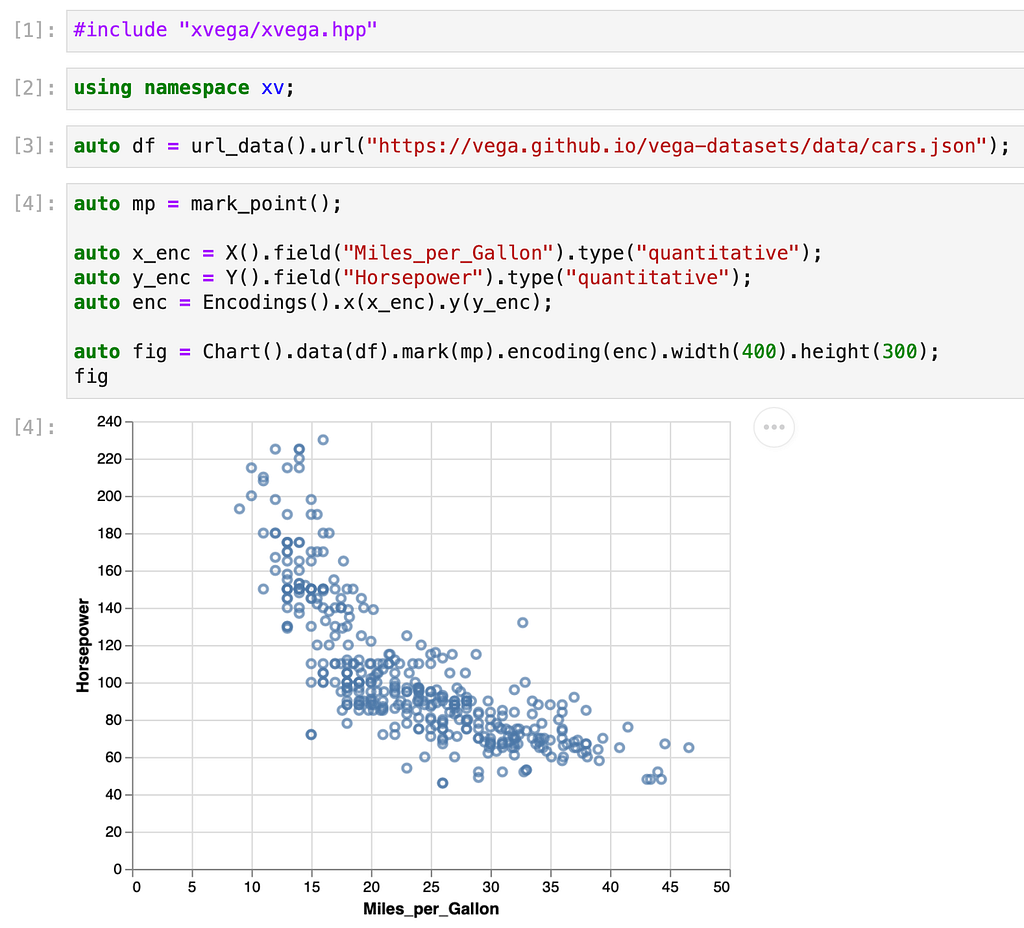
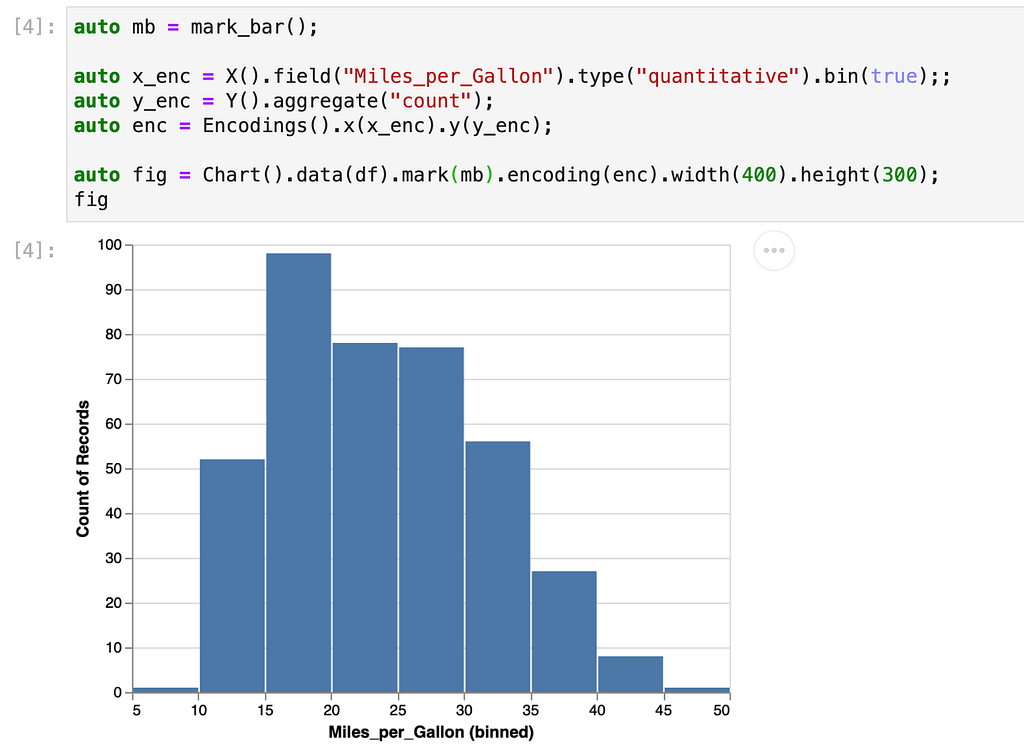
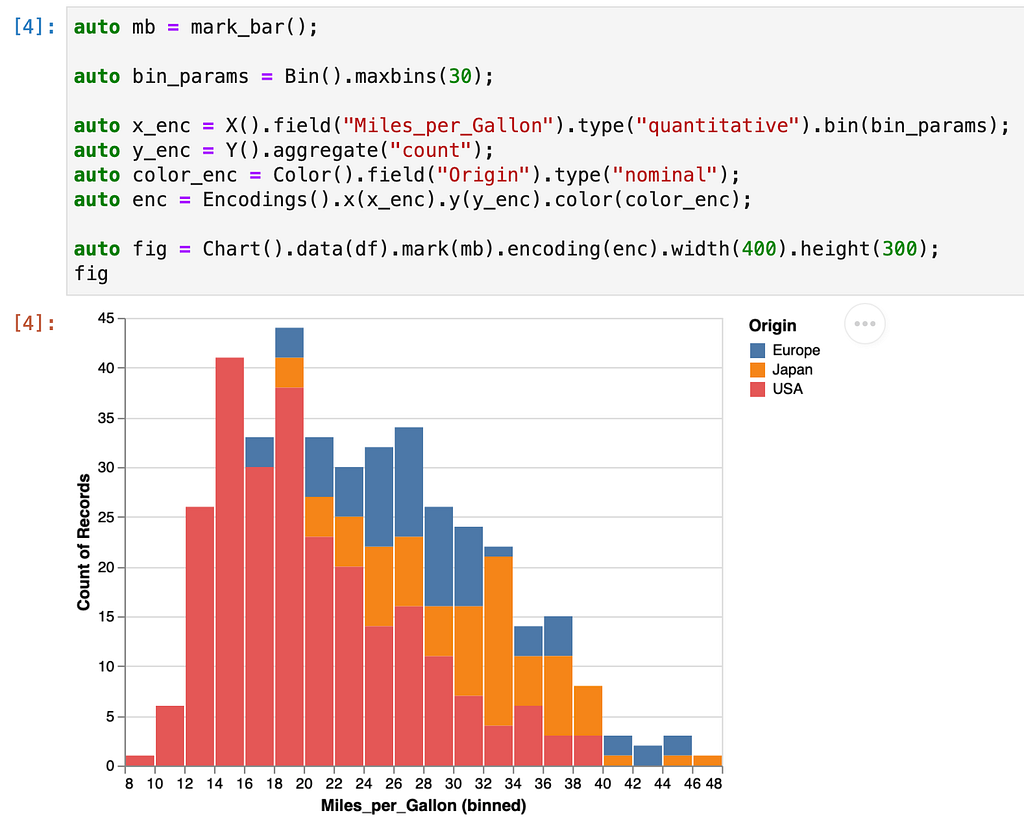
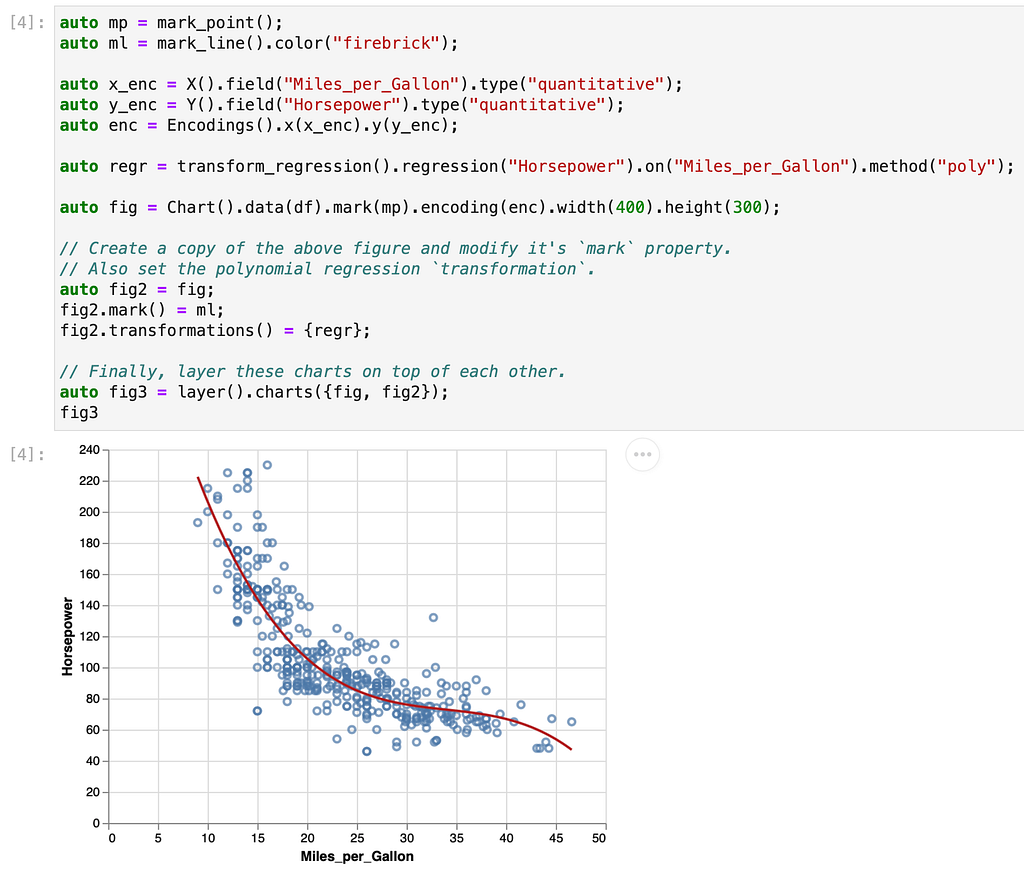
For the future of xeus-SQLite we want to create an intuitive form of visualizing data: creating plots, graphs, charts, maps and much more from your SQLite query results, all in the same notebook. Currently we’re exploring the use of Vegain xeus-SQLite, a declarative language for creating interactive visualization designs and can do bar plots using jupyter magics:
SQLite query result with bar and table outputs for same query
This feature is still in very early stages and being developed in this branch.
We also plan on producing a static build of xeus-SQLite bundling xeus and the SQLite library into a single executable that can be easily distributed.
Try it online!
You can try the stable version without the need of installing anything on your computer just by clicking on the image below:
This won’t grant you access to the experimental branch where we’re testing, if you’re interested in trying it please check the installation guide and make sure you’re in the right branch.
Installation
Note that you first need to have Jupyter installed on your computer. You can install xeus-sqlite using mamba:
mamba install xeus-sqlite -c conda-forge
Or conda:
conda install xeus-sqlite -c conda-forge
About the author
My name is Mariana Meireles and I’m a software developer working for QuantStack. I care deeply about the impacts that technology has in the world and try my best to be the change I want to see by contributing to open source projects that stand upon libre and diverse standards.
Prior to QuantStack I worked as a developer on the PySide team at the Qt Company and as a web performance developer at Mozilla.
A Jupyter kernel for SQLite was originally published in Jupyter Blog on Medium, where people are continuing the conversation by highlighting and responding to this story.
With glee, on February 7, we announced the return of the Jupyter community conference as a global event to be held in Berlin, Germany, in August. In a burst of enthusiasm, 174 people signed up to review for the technical program (you still can!).
Barely a month later (March 11), the World Health Organization declared COVID-19 a pandemic, tech companies had already made the call to cancel all travel, then Europe became the epicenter of the pandemic.
As we began working on contingency plans and negotiating with the contracted venue, we silently published the JupyterCon website, and the Twitter account fell silent. Now we’re ready to make public our plans for JupyterCon Online to be held October 5–17, replacing the in-person conference this year.
This is our vision for the conference of the future.
The key question is: in the absence of physical presence to celebrate our community, meet new people, and network for professional opportunities, what could be the incentives for attendees, speakers, sponsors, and volunteers to be part of the conference? A sharp focus emerged on career advancement and learning as the motivations.
We developed a vision in which a “conference” is now a learning platform, unconstrained by synchronous schedules or geographical location, coalescing a multitude of mini-events and rad new content, learning experiences, and online social interactions.
The project we developed comprises:
an online learning platform to create courses and organize content, providing user profiles to track learning and earn micro-credentials,
integrations with third-party tools for web conferencing and text-based threaded discussion,
online labs with access to JupyterHub/Binder attached to the content,
beyond just “talks,” content organized as mini-courses with permanent resources attached and ensuing conversation.
The conference of the future convergences with online learning and credentialing.
Conference Program
The technical program for JupyterCon Online will be selected by a team of topic track chairs, informed by volunteer reviewers, from submissions to the NOW OPEN Call for Proposals. Much of the program will be on-demand, but a few important pieces are planned to be live:
Tutorials: consist of prepared written materials and exercises in Jupyter notebooks, pre-recorded video by the instructor, live office hours with participants each day, and text-based discussion. The conference team will create a MOOC-style mini-course from the author-prepared materials. Participants completing the tutorials will receive certificates.
Keynotes: streamed live to YouTube each day, with private backchannel discussions in the JupyterCon Mattermost server, public backchannel on Twitter, and also live, moderated Q&A after the talk.
Regular presentations: pre-recorded, with timed release on YouTube Premiere, backchannel discussions in the private text-based forum, and in public on YouTube and organically on Twitter.
Panels of Speakers: since the regular presentations are pre-recorded, these are an opportunity for the audience to interact live with the speakers. We’ll cluster speakers by topic, for a live broadcast discussion with a moderator, after their pre-recorded presentations aired. Audience can submit questions ahead of time for moderators to choose, and can also ask live.
Posters: these are digital artifacts that can be static or interactive (e.g., Voilà dashboards), plus a pre-recorded 2-min pitch on video.
Live lightning talks: 5-min moderated live presentations, with a text-based backchannel discussion, but no Q&A with speakers.
Birds-of-a-feather: open-forum video chats organized organically among attendees.
Interviews with influencers in the community as an additional draw of activity and discussion. Other live panels not connected to pre-recorded talks (e.g., Q&A with JupyterHub developers).
Part of a larger initiative
I worked with NumFOCUS (where I’m co-chair of the Board of Directors) to develop a wider program that we named NumFOCUS Academy. It will boost the educational mission of the organization, whose signature program is the PyData conference series—also put at risk by the pandemic. We wrote a proposal for funding to the Sloan Foundation for development of a scalable ecosystem consisting of an online learning platform, a JupyterHub server, front-end websites for JupyterCon, PyData and NumFOCUS Academy, and services like e-commerce, single-sign-on, analytics, and so on.
Sloan approved the grant on May 20, making this ambitious project a reality!
The JupyterCon leadership also secured a Platinum sponsorship from OVH Cloud, who will host all infrastructure needs for the first year. (OVH already hosts nbviewer and a large part of MyBinder.)
Our technical partner is IBL Education: they will deploy and support the learning ecosystem, with Open edX as the centerpiece technology. (Read more: What’s Open edX?) IBL is behind the NVIDIA Deep Learning Institute, the Freshman Year for Free initiative of Modern States, and many other major digital learning initiatives. They also previously worked with me to develop Open edX extensions to create courses based on Jupyter notebooks.
JupyterCon Online will be much more than a conference. We conceived a long-term strategy with the key vision of magnifying career-advancement opportunities for all members of our community, and assembling a permanent library of learning resources.
The Jupyter ecosystem is a powerful platform for exploratory computational science, and now it can connect with some of the deep and rich domain-specific desktop applications that have decades of feature development already invested in them. With the integration of 3D Slicer with Jupyter through the xeus-python’s interpreter, we demonstrate how a Qt-based graphical desktop application with 3D visualization provided by Visualization Toolkit (VTK), image processing provided by the Insight Toolkit (ITK), can be used through a Jupyter notebook. This approach is available on the SlicerJupyter GitHub repository and could be extended to other applications that embed Python, such as Blender, FreeCAD, or ParaView.
This xeus-python integration is beneficial both for the Jupyter ecosystem and desktop applications. Features that have been developed for decades for desktop applications become readily available for Jupyter users without learning a new working environment or redeveloping features. For a desktop application, the Jupyter notebook can serve as a way to create reproducible data processing workflows, scientific publications, and maintainable tutorials without requiring local software installation. From Jupyter, you can now quickly create simple medical imaging applications with extremely rich interactivity from 3D Slicer. Read below for a discussion of the features available and the history of the project.
Powerful Medical Imaging Capabilities Available Through Jupyter
3D Slicer (or Slicer for short) is a C++ desktop application that uses Qt, ITK, and VTK libraries for visualization and medical image analysis. Slicer’s embedded Python interpreter makes all its features accessible with the Python programming language. Slicer has a simple built-in console to run Python commands interactively and can run Python scripts from files, but these are not as convenient as cell-base interactive notebooks, which have become popular among data scientists and researchers in recent years.
By integrating the xeus-python kernel, we can use a Slicer process as a Jupyter kernel. xeus-python leverages the xeus C++ implementation of the Jupyter kernel protocol. xeus-python is an alternative to ipykernel, which can be used with a vanilla CPython interpreter, interfacing to standard CPython Jupyter widgets like itkwidgets, but it can also be coupled with custom interpreters and GUI event loops, like the Slicer interpreter and its Qt event loop. This allows you to represent a complete scene in Medical Reality Markup Language, MRML, Slicer’s internal data structure. The kernel exposes the full medical imaging API and representation of your data in a meaningful way for Python developers, allowing access through standard Python ecosystem formats such as pandas dataframes and NumPy arrays in the Notebook.
Interactivity Levels
You can also use Jupyter interactive widgets (sliders, buttons, etc.) to control Slicer, modify data, or adjust processing and visualization parameters. Interactivity can be implemented at different levels.
Level 1: Standard Jupyter widgets display application specific objects by automatic conversion of application-specific data objects to standard Python objects. For example, Slicer markup fiducial lists are displayed as a nicely formatted table and model nodes are rendered as 3D objects.
Level 2: Static image widgets display content that the desktop application renders. These widgets can be made interactive by modifying data and rendering parameters using additional standard widgets. This makes rich visualization capabilities — sophisticated rendering various data types, rendering of very large data sets, etc. directly available in Jupyter.
Level 3: Dynamic viewer widgets display 2D and 3D views rendered by the desktop application. Mouse and keyboard events are forwarded to the desktop application that allows zooming/rotating views, and to utilize all 3D interactions implemented in the desktop such as placing annotations, making measurements, or segmenting images the same way as if it was done on the desktop appication’s screen. This is implemented in the Slicer Jupyter kernel using ipycanvas and ipyevents packages.
Level 4: Full desktop graphical user interface integration. Users can see parts of the application window rendered in notebook cells, including standard desktop widgets (sliders, menus, etc.). It is implemented using noVNC and TigerVNC in Slicer Jupyter. This is particularly useful when the application runs on a remote server.
These interactive tools allow developers to implement complete data processing workflows in a notebook, even if certain steps require manual user inputs such as segmenting 3D regions or setting seed points.
Try it online!
Since Jupyter notebooks can be used from any web browser, it can essentially turn any desktop application to a web application. By setting up a remote Jupyter server, users do not have to install anything on their computers. We have set up a demonstration of this using Binder (www.mybinder.org) that anybody can try at https://mybinder.org/v2/gh/Slicer/SlicerNotebooks/master.
Click on the binder image to launch the demo
The docker image that installs and configures Slicer and all dependencies (ipycanvas, ipyevents, VNC, etc.) is available at https://github.com/Slicer/SlicerDocker/tree/master/slicer-notebook. For deployment to non-technical users, applications can be deployed using Voilà (https://voila.readthedocs.io/), which only shows relevant content and interactive widgets, so the notebook looks like a simple dynamic web page.
The current implementation is already stable and offers a wide range of features, but there is still room for design and performance improvements. For example, we could not implement fully automatic conversion of application-specific data objects to displayable Python objects (due to complex implementation of display hooks); xeus-python debugger’s threading model needs to be improved to allow using it without locking the application’s main thread; and dynamic viewer widget’s performance (level 3 interaction) could be optimized to achieve higher refresh rates.
History of Slicer and this integration
Built over two decades with support from the NIH and a worldwide open source developer community, 3D Slicer is a unique, multi-platform desktop application for analysis, integration, and visualization of medical images that is heavily used by researchers globally for basic and applied research in a wide range of topics. The 3D Slicer Community includes physician-scientists with disease-specific knowledge of clinical challenges, computer scientists and physicists who develop novel algorithms, imaging informatics researchers, software engineers with the ability to understand clinical problems and create reliable tools, and application engineers with the multidisciplinary skills to deploy these tools in a range of cancer research settings. Slicer is maintained by Kitware, Inc., and the NAMIC consortium, and has an active open source software community. Slicer is used in hospitals and by researchers, with more than 10k academic citations and more than 150k downloads in the last year alone.
Click on the image to download 3D Slicer
It can be used for image processing workflows on 2D, 3D, and 4D images. What makes Slicer so useful is its huge set of community contributed modules that extend its functionality, as well as its ability to read DICOM and a wide array of exotic file formats.
Slicer has been scriptable in Python for well over a decade, but a robust SlicerJupyter extension is born from significant development effort by the community. The idea for this integration dates back to SciPy in 2014, when Jean-Christophe Fillion-Robin of Kitware organized a sprint intended to integrate Slicer and an IPython notebook, motivated by the dream of creating interactive and fun tutorials for Slicer. Mike Sarahan and Jean-Christophe created this proof of concept https://github.com/commontk/QEmbedIPython#qt-embed-ipython, but it was far from usable. In 2015 Matt McCormick of Kitware, created the SlicerDocker repository to support headless builds and rendering in a Docker image. Then in June 2018, while attending the Slicer Project Week, Andras Lasso (Queen’s University) and Jean-Christophe learned about Xeus, a C++ implementation of the Jupyter kernel protocol developed by QuantStack that would help streamline the integration of Slicer with Jupyter. To support this effort, Andras and Jean-Christophe created the Slicer/SlicerJupyter GitHub repository. They also contributed changes to Xeus to support this new integration paradigm where the event loop of the kernel is driven by a Qt-based Desktop application (see here). Building on this foundation, Isaiah Norton, then working at Brigham and Women’s Hospital, contributed additional improvements like a better auto-completion using jedi (see https://github.com/Slicer/SlicerJupyter/pull/12) as well as integration with Binder. More recently, Jean-Christophe and Sylvain Corlay (QuantStack) met after the Slicer project week while attending SciPy in Austin. Following the creation of a new project called xeus-python (started by Martin Renou at QuantStack), we took the integration of Jupyter and Slicer to the next level by adding support for improved interactive use and MRML data node visualization directly in the notebook.
About the authors
Alphabetically ordered
Sylvain Corlay is the founder and CEO of QuantStack, and a core Jupyter developer. He co-authored xeus and xeus-python.
Sylvain Corlay
Jean-Christophe Fillion-Robin is an open-source enthusiast, original author of the SlicerJupyter extension and a principal engineer at Kitware Inc where he leads the development of “3D Slicer” based commercial applications. J-Christophe also maintains scikit-build, an improved build system generator for CPython C/C++/Fortran/Cython extensions.
Jean-Christophe Fillion-Robin
Mike Grauer is a Technical Leader on the data and analytics team at Kitware. He is specialized in building scalable server-side processing frameworks that enable scientific workflows over web platforms.
Mike Grauer
Andras Lasso is an original author of the SlicerJupyter extension, Senior Research Engineer and Associate Director of the Laboratory for Percutaneous Surgery at Queen’s University.
Andras Lasso
Matt McCormick is an open source, medical imaging researcher working at Kitware Inc. Matt is an active, contributing member of scientific open source software efforts such as the Insight Toolkit (ITK) and scientific Python (SciPy) communities, and maintains the Jupyter 3D widget, itkwidgets.
Matt McCormick
Isaiah Norton is a Senior Software Developer at TileDB, Inc. with experience in digital pathology and image-guided surgical navigation.
Isaiah Norton
Steve Pieper is a Chief Architect and active developer of the 3D Slicer application for well over a decade. He is CEO of Isomics, Inc, where he uses a range of software technologies to perform medical imaging research with leading universities and companies.
Steve Pieper
Martin Renou is a scientific software developer at QuantStack. He is the original author of xeus-python, the xeus-based Python kernel, and contributed to the new concurrency model used for the debugger.
Martin Renou
Mike Sarahan is a software engineer at RStudio, PBC working on bringing language ecosystems together. He is passionate about making software work for data scientists in ways that are easy to maintain and improve.
Anima Anandkumar is Bren Professor of Computing and Mathematical Sciences at Caltech, and the Director of Machine Learning at NVIDIA. She was the youngest named chair professor at Caltech, has received many awards in a short time span, and has been featured in documentaries and media outlets like PBS, Wired, Forbes, MIT Tech Review and others.
Beyond her star power, Anima is a relentlessly outspoken and influential woman of the times. She has been public about her #MeToo experience at a previous place of work, and she spearheaded the #ProtestNIPS campaign to re-brand the Neural Information Processing Systems conference (now known as NeurIPS). The latter earned her a recognition in the 2018 Good Tech Awards of The New York Times.
She also advocates for responsible use of artificial intelligence, taking a stand specifically against face recognition services sold to law enforcement. This technology is currently still sufficiently inaccurate to be unsafe for use in high-consequence applications, and the product that Amazon made available in 2018, in particular, had high error rates when classifying the gender of dark-skinned women. In an open letter to Amazon, more than two dozen scientists (including Anima) refuted the claims Amazon was making on the scientific evaluation of the technology. Now, the letter has many more signatures, and the Association for Computing Machinery has called for a moratorium on the use of face recognition in high-risk settings.
Anima has a zeal for expanding the reach and understanding of AI in society. With Yisong Yue, she founded in 2018 the AI4science initiative at Caltech, which connects experts in data science and AI with researches across disciplines of science and engineering. She conveys that zeal to the boards of non-profits like #GoBeyondResumes, helping tech with skills-based recruitment, and Behind her Eyes, using virtual reality to combat bias and discrimination.
Nothing less than a trailblazer, her most celebrated contribution to machine learning was devising ways to use tensor algorithms in building statistical models, and having the insight that tensors are the natural mathematical representation for multi-modal data. Nowadays, tensors are everywhere in AI, but in 2014, when she published her most-cited paper on tensor decompositions, they were still obscure. Deep learning was just taking off then!
She and her collaborators released the TensorLy open-source library, which provides software support for tensor operations in Python. Its flexible backend allows using NumPy, MXNet, PyTorch, TensorFlow or CuPy to execute the computations efficiently on various hardware platforms, and to use tensor methods in combination with deep learning.
With a prolific and impactful career in academia, in parallel to high-profile positions in industry, one wonders how it is possible for Anima to also be a science communicator and activist for both responsible AI and diversity and inclusion in tech. But she is all these things, and with utmost grace.
Inviting keynote speakers for JupyterCon is both a nerve-racking and gleeful duty for the organizers. Our aspiration is to experience together an unforgettable moment of intellectual joy and inspiration. And that, dear reader, is a guarantee with our first advertised speaker: Professor Anima Anandkumar.
Anima Anandkumar was originally published in Jupyter Blog on Medium, where people are continuing the conversation by highlighting and responding to this story.
Jeremy Howard is co-founder of fast.ai, and researcher in residence on medical data science at the University of San Francisco. He is Chief Scientist at platform.ai, and held this role previously at doc.ai and Kaggle, where he was also President. Jeremy is a serial entrepreneur, having founded several successful companies after starting his career in management consulting. His most recent, Enlitic, was the first medical deep learning company, which just one year after its founding in 2014 had raised $15 million in two rounds of funding. He left the company two years after.
An open educator, Jeremy co-authored free courses on deep learning that have reached hundreds of thousands of learners around the world. He also co-authors an open-source library for deep learning called fastai, first released in 2018. The library sits atop PyTorch to provide a consistent interface for deep learning applications to images, text, time series, data frames and more. The second version of the library was announced in February this year with an arXiv preprint. All this work has recently come together as a book, written openly on Jupyter notebooks. Over the span of just a few years, he and fast.ai co-founder Rachel Thomas have done more to expand the reach and understanding of deep-learning technology than many global technology corporations.
Last March, as the COVID-19 pandemic was spreading around the world, Jeremy co-founded the #Masks4All campaign. It challenged the global consensus advice at the time on wearing face coverings to protect each other from infection. The campaign is estimated to have reached more than a billion people on social media, and was covered by global news outlets. “This has completely taken over my life,”said Jeremy in an April 1st interview. His June-19 epic tweet-thread reviewing the scientific evidence in support of mask-wearing is a paragon in science communication.
Jeremy has contributed to open source software throughout his career. He both contributed to and helped steer the Perl programming language through authoring requests-for-comments and chairing the Perl6-data working group. Among his latest projects is nbdev, a tool for developing Python libraries using Jupyter as the writing environment for both code and documentation. It empowers users to create hyperlinked documentation, Python modules, tests, and pip-installers, all from Jupyter notebooks, realizing the ideal of Knuth's literate programming. And expanding the potential of Jupyter as a writing environment for blogging, fastpages facilitates creating Jekyll blog posts on GitHub pages from content source in Jupyter notebooks. The posts can include interactive data visualizations, embed YouTube videos or Twitter cards, and show code snippets in collapsible blocks. Both these projects delight Jupyter enthusiasts with heaps of creative possibilities!
Even if a journalist writing about the impact of #Masks4all dubbed Jeremy a “little-known data scientist,”counting by GitHub stars and Twitter followers, he is really a data-science luminary. You all know him by now, and will be eager to hear him speak to our community in his JupyterCon keynote.
Like our first announced keynote speaker, Anima Anandkumar, Jeremy shines the light of his creative expression in diverse spheres of life and profession. We are thrilled and grateful to them both for allowing JupyterCon to host them!
Jeremy Howard was originally published in Jupyter Blog on Medium, where people are continuing the conversation by highlighting and responding to this story.
Juan Klopper and Lorena Barba in Delft, Holland, for the Global Open Education Conference, April 2018.
Juan Klopper is a medical doctor and surgeon at Groote Schuur Hospital, the academic hospital complex of the University of Cape Town, South Africa, and a senior lecturer in surgery. His specialty is emergency surgery, and he heads the hospital’s Acute Care Surgery unit. He is also the Head of Post-Graduate Surgical Research, the Head of Surgical Education, and the Faculty of Health Science representative on the University Senate Committee for Online Education.
An ardent open educator, Juan was recognized with the 2014 Educator Award of the Open Education Consortium, a global network for open education. His first collections of educational videos on YouTube focused on biomathematics, and acute care surgery, but he also created loads of teaching videos on physics and mathematics. At the time, he recorded a course on medical statistics using Excel, but he also ventured into a short set of Python lectures, and then a full-fledged course on Medical Statistics using IPython notebooks. He has since then developed courses on the Julia language, on R for medical statistics, and on Understanding Clinical Research using Google Colab — the latter also a Coursera MOOC that has enrolled more than 85,000 learners. Juan was the first educator from the African Continent to have a course on the Coursera platform.
Juan’s research focus is on improvements of healthcare through data science and mathematics. The unique blend of his decade-long career as an attending surgeon and years as an autodidact of mathematics and programming brings forth inventive projects applying technology to medicine. One uses convolutional neural networks to diagnose hemopneumothorax (air and blood in the chest cavity) in victims with gunshot or stab wounds. Another is looking into the diagnostic accuracy of magnetic resonance imaging for tuberculosis spondylitis in HIV-positive and HIV-negative patients. The surgical research unit that he heads at University of Cape Town has supported more than a hundred master’s and doctoral research projects.
In the resource-constrained environment of South Africa, such research efforts rely heavily on open source software tools. For both teaching and research, open source tools remove barriers to technology in the developing world. A number of initiatives involving and advocating open source software in Sub-Saharan Africa attest to the significant impact it can have in capacity building, public policy implementation, and economic growth.
Juan — not content with saving lives applying his surgical talents — has devoted himself to the open dissemination of knowledge. His motto is “Never stop learning,” and he shares his learning journeys openhandedly with his students and everyone else. I can’t wait to hear what he will share with the JupyterCon community.
Just like our previously announced JupyterCon keynotes — Anima Anandkumar and Jeremy Howard — this is an exciting chance to imagine how far our community can go impacting the world for the better. Oh, the anticipation!
Proposals for tutorials, talks and posters are being selected this week!
Juan Klopper was originally published in Jupyter Blog on Medium, where people are continuing the conversation by highlighting and responding to this story.
Building on a Jupyter Notebooks foundation, the de facto tool for data scientists, machine learning engineers and AI developers, Elyra is an open-source project that provides a set of AI-centric extensions to JupyterLab aiming to help users through the model development life cycle complexities, making JupyterLab even better for AI practitioners.
Elyra is proud to announce its 1.0.0 Release. This release brings usability enhancements and bug fixes for existing features, such as enhanced inline user documentation and validation capabilities for the Pipeline Editor, improved performance for pipeline submission to Kubeflow Pipelines runtime. It also provides new capabilities such as a new reusable Code Snippets extension and the ability to configure runtimes directly on the JupyterLab user interface.
On the platform side, Elyra 1.0.0 is now based on JupyterLab 2.x and can easily be integrated into a JupyterHub deployment or other containerized environments such as Kubernetes and OpenShift or even be run in standalone mode using local docker deployment.
With Elyra 1.0.0 we also provide some helpful use-case scenarios leveraging Elyra features to build AI pipelines in order to demonstrate in-depth capabilities exposed by the project. Use cases include:
If this is the first time you are hearing about Elyra, check out our announcement blog for more details about the project.
The 1.0.0 release of Elyra includes:
Notebook Pipelines visual editor
Ability to run notebooks as batch jobs
Reusable Code Snippets (new)
Hybrid runtime support (based on Jupyter Enterprise Gateway)
Python script execution capabilities within the editor
Python script navigation using auto-generated Table of Contents
Notebook navigation using auto-generated Table of Contents
Notebook versioning based on Git integration
Reusable configuration and editor for runtimes (new)
Support for JupyterLab 2.x (new)
JupyterHub Support (new)
Ability to try Elyra from Binder (new)
Support for JupyterLab Dark Theme
Elyra 1.0 extensions to JupyterLab
Notebook Pipelines visual editor
Elyra’s Notebook Pipeline Editor simplifies the conversion of multiple notebooks into batch jobs or workflows. By leveraging cloud-based resources to run their experiments faster, the data scientists, machine learning engineers, and AI developers are then more productive, and therefore able to spend more of their time focusing on their technical skills.
Based on the great feedback from the Elyra user base, this release brings lots of bug fixes usability enhancements such as:
Enhanced inline user documentation
Validation capabilities to Pipeline Editor that notifies users of missing or invalid configuration values
Optimized dependency handling providing a much faster submission of pipelines
Easier access to previously submitted experiments from the Pipeline Editor
Support for “bring your own image” to be used as the environment to execute Notebooks on the external runtime
Below you can see some of the Pipeline Editor UI enhancements introduced in Elyra 1.0:
Elyra Pipeline visual editor UI enhancements
Reusable Code Snippets
Code snippets give you the ability to save time and reuse task-oriented blocks of code. Elyra’s new code snippets extension enables easy discovery, creation, and insertion of reusable snippets of code into your Notebooks, Python Scripts, or even Markdown files used for documentation directly from the JupyterLab workspace. This makes the process of writing code more efficient and accessible.
The list of available code snippets is found in the left side pane and includes a preview of each snippet, and an option to either copy a snippet or insert it directly inline.
Elyra code snippets pannel
Code snippets can also be conveniently created and edited from within JupyterLab.
Elyra code snippets editor
Leveraging Table of Contents for Notebooks and Python Scripts
Navigating large files to find specific sections in Notebooks or function definitions in Python Scripts can be difficult tasks. The Table of Contents extension, which was enhanced to support navigating Python Scripts provides an easy outline of your contents, enabling easy navigation.
Below is an example of an auto-generated table of contents for a Notebook based on its markdown sections:
Auto-generated Notebook Table of Contents
To allow for streamlined python development, Elyra’s python editor is now accompanied by an auto-generated Table of Contents, which allows for efficient navigation within large python scripts.
Auto-generated Python Script outline using Table Of Contents
Reusable configuration and editor for runtimes
Elyra introduced a ‘shared configuration service’ that simplifies workspace configuration management, enabling things like information around accessing external runtimes to be configured once and shared across multiple components.
With Elyra 1.0, this service is now used by multiple components and has been enhanced with schema-based validation capabilities and a full set of REST APIs. With this release of Elyra, users can also easily browse, create, and edit these configurations from within the JupyterLab user interface.
Runtime configuration editor
JupyterHub support
With Elyra 1.0.0 we have also created a docker image and provided necessary configuration steps to integrate Elyra with JupyterHub.
Elyra & JupyterHub deployment diagram
Using Elyra in real Analytics and AI scenarios
While building Elyra, we work very closely with data scientists, machine learning engineers, and AI developers, and we have been building a few scenarios to validate the user experience when developing models and other applications using Elyra.
Analyzing COVID-19 time-series data
One of the examples creates a pipeline to analyze COVID-19 time series data sets from both the USA and Europe which is available as open-source in the covid-notebook GitHub repository.
COVID-19 notebook pipeline
Analyzing NOAA weather time series data set and explore forecasting
Another example utilizes DAX — Data Asset Exchange NOAA dataset and produces a pipeline that consumes and applies ETL into the dataset, and then goes about analyzing and experimenting with different forecasting capabilities.
NOAA weather time-series notebook pipeline
Elyra community adoption
The Elyra community is working very hard to promote adoption and create a healthy community around the project. In the past few months, we are starting to see some momentum, and below are some details :
Github Stars: Elyra main repository is reaching close to 500 as of August 2020, please continue to show your support for the project by spreading the word about the project and giving us more stars.
Projects depending on Elyra: Other then the two examples scenarios mentioned above, we are starting to see other communities adopting Elyra into their projects, CalPoly has been using the Elyra code snippets extension in their summer-intern projects and other communities are also experimenting with Elyra.
GitHub projects depending on Elyra
Downloads: We have also seen an increase of downloads of the Elyra npm packages in the past several weeks, and we are floating between 60k — 70k weekly downloads for the past month:
Elyra packages download stats
Elyra in the Enterprise: Components of Elyra are integrated and available in IBM Cloud Pak for Data and Watson Studio offerings.
Try Elyra from Binder
To experiment with Elyra without installing it locally, just click on the binder link below:
Try Elyra online on Binder
What is next for Elyra
Elyra is constantly making Jupyter Notebooks better aiming to help data scientists, machine learning engineers, and AI developers through the model development life cycle complexities, making JupyterLab even better for AI practitioners.
Come and join our weekly dev meetings to learn more about the most recent updates to Elyra and to ask your questions to the community, including the project core developers.
We would also appreciate for you to get involved with the Elyra project. Read our contributing guidelines, create new issues if you have questions, suggestions for new features, or to report any bugs. We also welcome contributions via GitHub pull requests.
Elyra reaches 1.0.0 was originally published in Jupyter Blog on Medium, where people are continuing the conversation by highlighting and responding to this story.
JupyterLab-ROS with Voilà to quickly make a standalone web app
The ROS open-source project (Robot Operating System) has become a de-facto industry standard in the robotics community. Very much like with Project Jupyter, a large collection of software has been built upon well-specified communication protocols. ROS has become a rich ecosystem of standardized tools for building and distributing ROS-based software, exploratory robotics development, and much more.
With Industry 4.0, the number of robots and smart devices has been increasing exponentially. We are talking about fully automated factories with hundreds of robots and thousands of connected sensors, generating large amounts of raw data.
There is an opportunity in bridging the ROS and the open-source data science ecosystems and tools.
For this reason, we set ourselves to bring together these ecosystems,
by producing a collection of JupyterLab extensions for ROS, turning JupyterLab into a cloud robotics command station,
by integrating ROS packages with conda / mamba package management system, to enable their installation alongside other open-source data-science packages.
JupyterLab, the cloud robotics command station
While the traditional developer tools from the ROS stack such as RViz are desktop-based, we think that a robotics development environment running in a web browser would provide a lot of flexibility. Also, the ideal robotics developer platform should be plugin-based, and easily extensible to account for the diversity of use cases to enable, from simple interactive scripting to visualization or large datasets. Finally, we should build this environment upon broadly adopted foundations, with open governance, and not let a single entity hold the keys to the ROS ecosystem.
Jupyter is a natural candidate to serve as the foundation for a web-based robotics development environment.
JupyterLab is a web-based interactive development environment that has many of the much-needed features
In JupyterLab, everything is a plugin, including the core components to the application. Anyone can produce a “remix” of core and third-party JupyterLab extensions to their needs.
Very much in the spirit of ROS, one of the keys to Jupyter’s success is that the project was built upon well-documented and specified protocols and file formats that anyone could implement.
Jupyter is a multi-stakeholder project, not backed by a single corporation, but by a community of developers at a variety of companies, universities, as well as individual contributors.
Today, we are announcing the first beta of JupyterLab-ROS, a collection of JupyterLab plugins to integrate ROS with the JupyterLab platform. We combine the best of the data-science and robotics worlds to help developers build custom solutions for the industry. ROS can run in a high-performance server while JupyterLab is accessed in a web-browser (on Windows, OS X or Linux).
JupyterLab-ROS
JupyterLab-ROS automatically starts a rosmaster and rosbridge_server making all the painful setup of WebSockets connections completely transparent to users. A status bar widget allows you to start and stop the rosmaster server with a simple click and displays its state in real-time. Internally this widget runs a launch file which can be changed from the JupyterLab settings UI to launch additional nodes.
Master status widget
Another important component of the ROS stack is RViz, a desktop-based 3-D visualization tool. It’s web-based counterpart in JupyterLab is Zethus, started by Rapyuta Robotics. This plugin supports most of the display types supported by RViz. It also provides an info panel that displays the raw messages in realtime, and a web-based version of rqt_graph for visualizing the ROS node graph.
Zethus
A robotics station would be incomplete without a tool for debugging. For that purpose, ROS provides rosconsole, a package which allows developers to send messages to rosout and make them available on every node. The console gives access to these debugging messages in JupyterLab and provides additional features such as filtering by level and by node.
Log Console
Robotics Notebooks
A key component to the Jupyter stack is the Notebook, an open-source web application that allows you to create and share documents that contain live code, equations, visualizations and narrative text. It’s frequently used to do data cleaning and transformation, numerical simulation, statistical modelling, data visualization, machine learning etc.
The notebook could be the perfect tool for robotics researchers and educators to make (and share) experiments in control algorithms, working in a dynamic and interactive development environment that allows quick prototyping and exploratory analysis while having access to the sophisticated mathematical libraries already well integrated with Jupyter. It can be tedious to have a different platform for interacting with robots and processing the data obtained from these, JupyterLab-ROS combines both toolsets and enables an integrated workflow.
At the same time, many projects are becoming more and more interdisciplinary. Currently, it is common to see projects mixing topics like machine learning and robotics. JupyterLab-ROS opens a new world of possibilities for machine learning researchers that are interested in applying their models to robots: now they have the possibility of connecting a robot to a development environment that they are very familiar with.
JupyROS is another powerful library that leverages ipywidgets and bqplot to integrate ROS in Jupyter Notebooks, being able to show real time plots from ROS messages and create intuitive forms to control robots in minutes.
Interactive Robotics in the Jupyter Notebook, with live plotting
ROS Package management
Modern scientific computing applications typically depend on a large number of libraries. Conda-forge is a community initiative to package scientific libraries for the conda package manager, and has become a de-facto standard source of packages for the scientific computing community, with tens of thousands of available packages, and thousands of contributors.
During the last year, we have worked hard to package more and more of ROS as conda packages. Conda-packages for ROS Melodic, including RViz are now available on all three operating systems! You can find the packages on the RoboStack channel (a more detailed blog post about this is going to follow soon).
Conda can be used to create virtual environments for ROS projects, which makes it possible to install Melodic, Kinect and Dashing side-by-side on the same Linux system, and have exact control over package versions.
We are also working on Mamba, a conda-compatible package manager implemented in C++. Together with Boa this effort will help to continuously build and release ROS packages on conda.
Try it online!
You can try the JupyterLab-ROS extension online without installing anything by just clicking on the following binder link:
JupyterLab-ROS is under active development. We are working on new features such as a rosbag widget to play and record bag files and improving existing ones like the roslaunch widget. If you are interested in contributing to JupyterLab-ROS you can find the code at this repository in the RoboStack organization. Contributions are always welcome!
Installation
You can install JupyterLab-ROS using Mamba, the first step to create a new environment with JupyterLab and the ROS packages necessary, then you can install the extension.
If you have any questions don’t hesitate to contact us on the RoboStack or QuantStack chats.
This work has many collaborators around the world, and we are especially grateful to Deep Chaitanya & Ashish Chaudhary from Rapyuta Robotics, Sean Yen from Microsoft for his amazing work on vinca that automagically generates the conda-recipes, Tobias Fischer for many patches and pushing us to bring OS X support to the conda packages as well. Many thanks to Jeremy Tuloup for his help with the JupyterLab extension system.
About the authors
Wolf Vollprecht works as a scientific and robotics software developer for QuantStack in Paris and Berlin.
Carlos Herrero is a Computer Engineer passionate about AI and his applications on robotics. Currently working at QuantStack helping to develop Open Source projects.
JupyterLab-ROS was originally published in Jupyter Blog on Medium, where people are continuing the conversation by highlighting and responding to this story.
Jupyter Book is an open source project for building beautiful, publication-quality books, websites, and documents from source material that contains computational content. With this post, we’re happy to announce that Jupyter Book has been re-written from the ground up, making it easier to install, faster to use, and able to create more complex publishing content in your books. It is now supported by the Executable Book Project, an open community that builds open source tools for interactive and executable documents in the Jupyter ecosystem and beyond.
❗❗ Jupyter Book is still in beta, so things are always changing. We’d love your feedback, ideas, and PRs for how to make the project better!❗❗
What does the new Jupyter Book do?
The new version of Jupyter Book will feel very similar. However, it has a lot of new features due to the new Jupyter Book stack underneath (more on that later).
The new Jupyter Book has the following main features (with links to the relevant documentation for each):
In the next few sections we’ll talk about some major changes that you may notice in Jupyter Book.
An enhanced flavor of markdown
The biggest enhancement to Jupyter Book is support for the MyST Markdown language. MyST stands for “Markedly Structured Text”, and is a flavor of markdown that implements all of the features of the Sphinx documentation engine, allowing you to write scientific publications in markdown. It draws inspiration from RMarkdown and the reStructuredText ecosystem of tools. Anything you can do in Sphinx, you can do with MyST as well.
MyST Markdown is a superset of Jupyter Markdown (AKA, CommonMark), meaning that any default markdown in a Jupyter Notebook is valid in Jupyter Book. If you’d like extra features in markdown such as citations, figures, references, etc, then you may include extra MyST Markdown syntax in your content.
For example, here’s how you can include a citation in the new Jupyter Book:
A sample citation. Here we see how you can include citation syntax in-line with your markdown, and then insert a bibliography later on in your page.
And here’s how you can include a figure:
A sample figure. Here we see how you can insert a figure with a caption into your book, and control some aspects of how the figure is displayed with options.
A smarter build system
While the old version of Jupyter Book used a combination of Python and Jekyll to build your book’s HTML, the new Jupyter Book uses Python all the way through. This means that building the HTML for your book is as simple as:
jupyter-book build mybookname/
In addition, the new build system leverages Jupyter Cache to execute notebook content only if the code is updated, and to insert the outputs from the cache at build time. This saves you time by avoiding the need to re-execute code that hasn’t been changed.
An example build process. Here the jupyter-book command-line interface is used to convert a collection of content into an HTML book.
More book output types
By leveraging Sphinx, Jupyter Book will be able to support more complex outputs than just an HTML website. For example, we are currently prototyping PDF Outputs, both via HTML as well as via LaTeX. This gives Jupyter Book more flexibility to generate the right book for your use case.
You can also run Jupyter Book on individual pages. This means that you can write single-page content (like a scientific article) entirely in Markdown.
A new stack
The biggest change under-the-hood is that Jupyter Book now uses the Sphinx documentation engine instead of Jekyll for building books. By leveraging the Sphinx ecosystem, Jupyter Book can more effectively build on top of community tools, and can contribute components back to the broader community.
Instead of being a single repository, the old Jupyter Book repository has now been separated into several modular tools. Each of these tools can be used on their own in your Sphinx documentation, and they can be coordinated together via Jupyter Book:
MyST-NB is an .ipynb parser for Sphinx that allows you to use MyST Markdown in your notebooks. It also provides tools for execution, cacheing, and variable insertion of Jupyter Notebooks in Sphinx.
Jupyter Cache allows you to execute a collection of notebooks and store their outputs in a hashed database. This lets you cache your notebook’s output without including it in the .ipynb file itself.
Sphinx-Thebe converts your “static” HTML page into an interactive page with code cells that are run remotely by a Binder kernel.
We’ll write a more developer-focused post in the future to describe each of these components in more detail.
What next?
Jupyter Book and its related projects will continue to be developed as a part of the Executable Book Project, a community that builds open source tools for high-quality scientific publications from computational content in the Jupyter ecosystem and beyond.
If you’d like to contribute to any of the projects listed in this post, you are highly encouraged to do so! The Executable Book Project (and thus Jupyter Book) is run as an open project that welcomes contributions from others.
We are excited about all the new features and improvements in the new Jupyter Book, and look forward to seeing the new books that the community creates with this stack!
Announcing the new Jupyter Book was originally published in Jupyter Blog on Medium, where people are continuing the conversation by highlighting and responding to this story.
Lucy D’Agostino McGowan demonstrating her DIY light board
Lucy is an assistant professor of statistics at Wake Forest University in North Carolina. She previously was a postdoctoral fellow at the Johns Hopkins Bloomberg School of Public Health, where she worked with Prof. Jeffrey Leek. Before starting her PhD in biostatistics at Vanderbilt University, Lucy worked as a statistical data analyst at the Washington University School of Medicine.
A co-founder of R-Ladies Nashville, creator of online courses, and developer of several R packages, Lucy is an avid organizer, communicator and member of the R community. In her blog, she writes about statistics in medicine, using and teaching R, and her experience as an early career academic. She co-hosts the Casual Inference podcast with Ellie Murray from Boston University, where they talk about statistics, data science and epidemiology.
Lucy and her colleagues at Wake Forest are embracing the challenge of teaching during a pandemic, showing both creativity and collegiality with peer-to-peer communities for learning how to teach online. In the photo above you see her with her self-made light board for preparing class videos. She teaches statistical modeling and statistical learning, and I can’t wait to watch her videos — I see a rising star in the open education sphere.
She does research in causal inference, observational study methods, and applications of statistics in medicine. In one recent study she collaborated on, the team looked at the risk of opioid therapy for veterans with rheumatoid arthritis and mental health concerns. Another looks at the effectiveness of dressings with collagen on wounds that resist healing. The common thread is applying a deep understanding of statistics to hard problems in health care. It seems today more than ever we need researchers with this focus. To Lucy, “medicine is a data science.”
In her latest project, the team developed a mathematical model to analyze the impact of test-trace-isolate programs on the dynamics of infectious transmission. She then built an application based on this model, ConTESSA (Contact Tracing Evaluation and Strategic Support Application), to support managers of contact-tracing programs. Lucy and her collaborators also created a MOOC to teach about the indicators of performance of a contact-tracing program, how to use the ConTESSA tool to estimate the effect of these indicators on transmission, and how to strategize to increase the impact of the overall program. The MOOC is free on Coursera, and starts today.
In these troubled times of weaponized misinformation, and a global health crisis on a polarized and deeply unequal societal backdrop, the world needs charismatic science communicators like Lucy. Her system for effective statistical communication, shared in her recent talkat the Joint Statistical Meeting (JSM), should be in every student’s curriculum. She teaches us all to be mindful of the audience, adapt our content, and convey data-powered messages so they are both interesting and true.
I am delighted to shine a spotlight on such a multitalented young educator and researcher, and to introduce her to the Jupyter community. I also can’t wait to learn from her in what no doubt will be an illuminating keynote. She joins the growing list of awesome speakers we’re lining up for JupyterCon 2020:
Talk and tutorial selections are complete, and authors are being notified. Get ready for the program!
Lucy D’Agostino McGowan was originally published in Jupyter Blog on Medium, where people are continuing the conversation by highlighting and responding to this story.
By: Lindsey Heagy, Fernando Pérez, Joe Hamman and the Jupyter meets the Earth team (cross-posted on the Pangeo Blog)
As a part of the 2020 EarthCube annual meeting, we held a Jupyter meets the Earth community discussion session on July 27. The Jupyter meets the Earth project is an EarthCube funded effort that combines research use cases in geosciences with technical developments within the Jupyter and Pangeo ecosystems. In this model of equal partners, scientific questions help drive software infrastructure development, and new technologies expand the horizons of viable research. This online workshop was an opportunity to gather members of the community, welcome newcomers, provide updates on the Jupyter and Pangeo ecosystems, and have time for discussion.
The goals for the meeting were to:
Provide an overview of the Jupyter & Pangeo ecosystems for researchers from the EarthCube community.
Outline avenues for getting involved.
Gather input for what advancements would best serve your research needs.
Over 100 participants registered, and we had contributions from 9 speakers. The meeting was a mix of presentations and Q&A from the community. The full recording of the meeting is available on youtube, and we encourage continued discussion on the associated discourse post.
Fernando Pérez (slides) started off the meeting by introducing the Jupyter meets the Earth project — an effort aimed at driving forward technological developments in the Jupyter and Pangeo ecosystems in partnership with researchers in the geosciences. The motivation is to advance research and the software that supports it by combining domain expertise with methods in data science, software & data engineering practices. He provided an overview of Project Jupyter, highlighting the interplay between software and content, services, standards, community and governance that is necessary for broad-impact scientific open source software projects. He presented the extensible JupyterLab platform, that can be adapted to domain-specific needs as illustrated by the FlyBrainLab and Cloud Robotics Command Station efforts. The Jupyter meets the Earth team aims to similarly develop tools and extensions that will support interactive computing workflows in the geosciences.
Overview of Jupyter and Jupyter meets the Earth from Fernando Pérez
Next up, Scott Henderson (slides) provided an overview of Pangeo and associated community events, including Hackweeks. “Pangeo is first and foremost a community promoting open, reproducible, and scalable science.” In terms of technology, this involves developing fully open source tools that can be deployed on shared computational infrastructure, such as HPC centers or the cloud, and hosting several forums to foster communication between scientists and software developers. Software is an important avenue for connection, but the overarching goals are a rallying point for a community. The critical mass of enthusiastic people has been key to the success of the Pangeo model.
The Pangeo model is intended for use both on the cloud and on High Performance Computing (HPC) infrastructure. Kevin Paul gave the third talk on Pangeo on HPC (slides, notebook). HPC and cloud computing environments present technical differences in terms of usage patterns, file access, and resource allocations, however, the goals of Jupyter and Pangeo are similar in both cases — to enable interactive computing and simplify the user experience on both. Tools such as dask and dask-kubernetes/dask-jobqueue are targeted at enabling parallel computing on both infrastructures.
Kevin Paul giving us a demo of Pangeo on the Cheyenne supercomputer
After a Q&A session that included questions on the computational cost of running Pangeo Infrastructure and efficient use of tools including Zarr, we moved on to a series of lightning talks.
Lightning Talks
Six speakers presented short lightning talks on aspects of the Jupyter and Pangeo ecosystems ranging from technologies to scientific applications to opportunities to engage with the Pangeo community.
Anderson Banihirwe (notebook and details in intake-esm) kicked off the lightning talks by giving a demo and overview of Intake — a project to streamline loading and sharing of data. He showed a demo that included both Optimum Interpolation Sea Surface Temperature (OISST) data, as well as data from the Coupled Model Intercomparison Project (CMIP) running interactively on Cheyenne, the supercomputer at NCAR and using Dask for distributing the workload across nodes, with real-time diagnostics of the distributed computation provided by Dask’s JupyterLab extension.
Next up, Scott Dale Peckham (notebook) gave a presentation that demonstrated the use of ipywidgets and ipyleaflet to create an interactive interface for fast access to geoscience data on servers that support the OpenDAP protocol. The project he champions is called BALTO, the Brokered Alignment of Long Tail Observations (also a famous Siberian Husky and sled dog). These graphical interface elements can be used in a programmatic workflow such as a Jupyter Notebook, but they conveniently encapsulate many details of accessing the data and resources provided by BALTO. This allows the scientists to focus on their research questions, without having to break their workflow to access data with external tools.
BALTO GUI demo from Scott Peckham
We then had a talk from Edom Moges (slides) who presented work he is conducting with Laurel Larsen’s research group in hydrology as one use case in the Jupyter meets the Earth project. The presentation focused on a data synthesis work that aims to build a Jupyter based interactive platform that transforms raw hydrometeorological data to a gap-filled ready to use data for several intensively monitored watersheds across the US. The platform will be a basis for future community initiatives to benchmark data processing approaches, support comparative hydrological studies and comprehensive data-driven forecasts.
Lightning talk from Edom Moges and Laurel Larsen on the hydrology use-case in the Jupyter meets the Earth project
Georgiana Dolocan (video) impressed us next with an animated video accompanied with her narration to explain JupyterHub, its components (authenticator, spawner, proxy) as well as deployment options. The littlest JupyterHub (TLJH) is designed to make it simple to deploy multi-user Jupyter infrastructure on a single machine, and the more sophisticated Zero 2 JupyterHub Kubernetes (Z2JH) option is meant to scale to many users and large computational needs.
Presenting from the perspective of an enthusiastic user, Erik Sundell (slides) gave us an overview of Jupyter Book: a tool to quickly create beautiful websites from notebooks and markdown. He walked through how to host them for free online in a time efficient way, and highlighted features including connections to Binder, which enable users to run content interactively.
Joe Hamman (slides) finished off our lightning talk session by outlining avenues for connecting with the Pangeo community. These include day-to-day communication on GitHub, Gitter, discourse and twitter, as well as more recent coffee-breaks. Depending on your topic of interest, there are also working groups that you can join on topics including data, machine learning, education, cloud computing, or you can suggest your own!
Connecting with the Pangeo community — an overview from Joe Hamman
Follow up and further discussion
To continue the discussion afterwards, we posed (slides) a few questions where we hope to learn from the community’s needs, such as:
What does your interactive computing workflow look like today? What do you envision it will be in 5 years?
How would you like to publish and share your computational research and where can improvements be made?
How do you stay up to date with the evolving open-source ecosystem? How would you like to be keeping up-to-date?
We are looking for your input and ideas! Please add your thoughts to the discourse post.
Thanks
Thank you to the participants, speakers, and especially Lynne Schreiber and Ouida Meier from the EarthCube office for all of their support and work (even with very last-minute requests!).
This work is part of the Jupyter meets the Earth project, supported by the NSF EarthCube program under awards 1928406, 1928374.
One of the main changes in nbconvert 6 is the refactor of the template system, which should be easier to extend and build upon.
In this article, we dive into the template system, and provide a tutorial on how to build a custom template for nbconvert or Voilà.
From Classic to Lab
My notebooks look different!
If you are accustomed to convert notebook files to HTML by typing
jupyter nbconvert notebook.ipynb --to html
you may have noticed differences in the generated HTML when switching to the latest release of nbconvert. In fact, nbconvert now produces the same DOM structure as JupyterLab’s notebook implementation, which is styled with JupyterLab’s CSS.
One can even apply the dark theme:
jupyter nbconvert xleaflet.ipynb --to html --HTMLExporter.theme=dark
The HTML output of nbconvert with the lab template andthe dark theme
While JupyterLab uses CodeMirror to render code cells, nbconvert makes use of the Pygments library to produce syntax-colored static HTML. To mimick the JupyterLab CodeMirror styling, we created a Pygments theme called jupyterlab-pygments. JupyterLab Pygments uses JupyterLab’s CSS variables for coloring and will therefore reflect the theme that is applied to the notebook.
Note: at the moment, only the default light and dark themes are supported, but we plan on adding support for third-party JupyterLab themes after the release of JupyterLab 3, which introduces a new packaging system for extensions.
But I wanted my notebooks to look the same!
Well, if you want to retain the classic notebook styling that was used in earlier versions of CSS, it is still possible using the classic template.
jupyter nbconvert xleaflet.ipynb --to html --template classic
The HTML output of nbconvert with the classictemplate
With this template, you retrieve the original style of nbconvert outputs and of the classic notebook.
Another perk of the new nbconvert release is the WebPDF exporter. The WebPDF exporter supports the same templates and themes as the HTML exporter, and produces a PDF output that renders the same rich content as the HTML exporter, such as rich HTML tables, widgets etc.
The WebPDF output of nbconvert with the lab template andthe dark theme
Executing the notebook before rendering
Nbconvert’s two main categories of transformations are preprocessors and exporters. Preprocessors take a notebook as an input, and return a transformed notebook, while exporters return other types of content, such as HTML or PDF. An important preprocessor is the ExecutePreprocessor, which spawns a kernel for the notebook, execute all cells, and populate outputs.
It can be invoked before the export by passing --execute. For example, the xleaflet.ipynb notebook uses the xeus-cling C++ kernel and makes use of the xleaflet interactive widget, which can be displayed when converting to HTML or with the WebPDF exporter.
jupyter nbconvert xleaflet.ipynb --to html --execute
The HTML output of nbconvert with the execute preprocessor
Similarly, the WebPDF exporter will also display interactive widgets!
The PDF output of nbconvert with the execute preprocessor
Note: Future plans for the WebPDF exporter include offering more options to users with respect to page breaks, and providing bookmarks for the main sections of the document.
Nbconvert templates
Unlike with earlier versions of nbconvert, templates are now directories, which may contain a jinja template but also other assets, such as macros, CSS files etc. The nbconvert template system also provides an inherittance mechanism which makes it simple to tweak existing templates in a derived one, by overriding bits of it.
Selecting a template
Most exporters in nbconvert are subclasses of TemplateExporter, and make use of jinja to render notebooks into the destination format. Nbconvert templates can be selected by name with the --template command line option.
For example, the reveal template, shipped with nbconvert, turns Jupyter notebooks into HTML slideshows using the RevealJS library. Which cells should be skipped, or where breaks betweens slides should be, are specified in the notebook cell metadata. The classic notebook and JupyterLab both provide means to set the appropriate values.
To select the reveal template, simply type:
jupyter nbconvert <path-to-notebook> --to html --template reveal
In the case of the xleaflet.ipynb notebook showed earlier, we get:
Creating a reveal slideshow with the dark theme
This demonstrates that the nbconvert templating system can be used to completely override how we look at notebook documents. Using metadata, we can even create arbitrary layouts and rich views of the same content.
Where are nbconvert templates installed?
Nbconvert 6 templates are directories containing resources such as jinja templates and other assets. They are installed in the data directory of nbconvert, namely <installation prefix>/share/jupyter/nbconvert.
Running jupyter --paths shows all Jupyter directories and search paths. For example, on Linux, jupyter --paths returns:
In our case, only the data section is relevant. Listing the content of <sys-prefix>/share/jupyter/nbconvert/templates in a raw installation of nbconvert will show
$ ls <sys-prefix>/share/jupyter/nbconvert/templates
asciidoc base classic compatibility html lab latex markdown python reveal rst script
The base template should not be used directly, but is typically inherited from. Thecompatibility directory provides some content for backward compatibility with earlier verions of nbconvert. Three templates are available for the HTML exporter: lab, classic, and reveal.
The content of nbconvert templates
The conf.json file
Nbconvert templates all include a conf.json file used to indicate the base template that it is inheriting from, the mimetype corresponding to that template (which determines which exporters are compatible with it, and which file is the entry point), and preprocessors to run when using that template before running the exporter. For example, inspecting the configuration of the reveal template we see that
it inherits from the lab template,
exports text/html, and therefore will only work with the HTML and WebPDF exporters.
and runs two preprocessors called 100-pygments and 500-reveal:
The CSSHTMLHeaderPreprocessor inlines the CSS required for the syntax highlighting of input cells.
The RevealMetadataPreprocessor massages the notebook metadata and consumes the information required to set up the layout of the slideshow.
Nbconvert walks up the inheritance structure determined by conf.json and produces an agregated configuration, merging the dictionaries of registered preprocessors. The ordering of the preprocessor names determines the order in which they will be run.
Jinja templates
Besides the conf.json file, nbconvert templates most typically include jinja templates files. They may also override files from the base templates, or provide extra content.
For example, inspecting the content of the classic template located in share/jupyter/nbconvert/templates/classic, we find the following content:
we see that it includes the index.html.j2 jinja template (which is the main entry point for HTML exporters) as well as CSS and a base template file in base.html.j2. The only preprocessor listed in conf.json is the pygments syntax highlighting…
Inheritance in Jinja
In nbconvert, jinja templates can inherit from any other jinja template available in its current directory or base template directory by name. Jinja templates of other directories can be addressed by their path from the Jupyter data directory. Using the path is also useful when using a jinja template that may be overriden locally.
For example, in the reveal template, index.html.j2 extends base.html.j2 which is in the same directory, and base.html.j2 extends lab/base.html.j2. This approach allows using content that is available in other templates or may be overriden in the current template.
Building a custom template
Now, let’s create a custom template! If you work at ACME Corporation, you may want to create a template that follows the graphical charter of ACME Corp, and includes the logo in a banner.
Besides the logo, titles should also use the “ACME Regular” font, which has a cartoon-style look. The other parts of the template are inherited from the regular lab template.
Setting up a logo banner, and the font change, the acme nbconvert template produces the following result with a very simple notebook:
jupyter nbconvert acme.ipynb --to html --template acme
The HTML output of nbconvert with the acme template
Now you can create sophisticated templates making use of sophisticated front-end framework and processing the notebook metadata in creative ways!
The source for the ACME nbconvert template is available here. Beyond the template files in share/jupyter/nbconvert/acme, the repo provides the logic for packaging this template into a PyPI wheel with data files. You will also find content related to the use of that template with Voilà, which is the subject of the next section.
From nbconvert templates to Voilà templates
Voilà turns Jupyter notebooks into standalone web applications and dashboards.
It differs from nbconvert in that the output web application is connected to a Jupyter kernel, allowing it to respond to user input through widget controls and other UI components, while with nbconvert, any action that requires a roundtrip to the kernel will not work.
However, Voilà leverages the nbconvert template system to benefit from their flexibility in overriding the front-end looks and behavior. From a user standpoint, the system is made so that the same templates will be usable for both systems.
However, template authors interested in advanced features of Voilà may be interested in the following information.
Where are Voilà templates installed?
Voilà templates are installed in the <installation prefix>/share/jupyter/voila directory (while nbconvert templates are in <installation prefix>/share/jupyter/nbconvert).
Just like nbconvert templates, Voilà templates are directories, they use the same conf.json configuration mechanism.
Voilà can use nbconvert HTML templates without modification.
When there exists an nbconvert and a Voilà template of the same name, the conf.json files are recursively merged, as well as the content of the directory, with a higher precedence for the Voilà template.
Overriding nbconvert templates with Voilà
When specifying the acme template that we developed earlier, with command
voila xleaflet.ipynb --template acme
Voilà will look pick up the acme nbconvert template. Since this template inherits from lab and Voilà has an overridden lab template (with e.g. the logic for rendering widgets), it will pick up the Voilà flavor of the lab template. Most typically, the Voilà flavor of a template does not add much on top of nbconvert besides boilerplate such as
a call to the macro that includes the JavaScript assets for the Voilà front-end logic.
calls to macro related to error logging when using the Voilà preview.
calls to macros related to the progressive rendering of notebooks as it is being executed, and the display of an “in-progress” spinner.
These macros are provided in the base Voilà template, and can also be overridden in derived templates.
Future developments
In the coming weeks and months, we plan on polishing the experience of nbconvert users.
JupyterLab 3, which should be released shortly, includes a more dynamic extension system which does not require the main JupyterLab application to be rebuilt. We plan on adding support for a category of lab extensions called “mime renderers“ which are used for rich rendering of data in cell outputs. This should enable the use of complex mime types such as GeoJSON or Vega visualizations in nbconvert and Voilà.
We are working on improving the reveal template, to include a custom reveal theme making use of JupyterLab CSS variables, so that it can be easily combined with JupyterLab themes.
The JupyterLab 3 extension system may also enable us to enable third-party JupyterLab themes in nbconvert.
The WebPDF exporter should expose options on output format and where page breaks should be. At the moment, we prevent page breaks until the maximum dimensions of PDF documents are reached.
Acknowledgements
Many people were involved in the nbconvert 6 release! The full list of contributors is available here.
Among them, we are especially indebted to Maarten Breddels, who was the main architect of the new template system.
We owe the split of the execute preprocessor and the new nbclient package to Matthew Sealand David Brochart. Matthew took on a large amount of maintenance work on the project over the past year.
The work on Voilà and nbconvert by the QuantStack team was funded by Bloomberg.
About the Author
Sylvain Corlay is the CEO of QuantStack, an open-source software development team specialized scientific computing comprising maintainers of major projects of the ecosystem.
As an open-source developer, Sylvain is mostly active in the Jupyter ecosystem, and the general PyData stack. He is currently a steering committee member for Project Jupyter, and a member of the board of directors of NumFOCUS.
Omoju Miller is Technical Advisor to the CEO at GitHub, where she was previously a Senior Machine Learning Engineer. She has a PhD in computer science education from UC Berkeley and an MSc degree in Intelligent Systems from University of Memphis. While a PhD candidate, Omoju worked at Google, co-leading the non-profit computer science education portfolio and helping launch several initiatives, including Made with Code, a program aimed at increasing the participation of girls in computing. She was also member of a team that won a White House hackathon on data and education, the Education Datapalooza, and later had the opportunity to advise the Presidential Innovation Fellows initiative on aspects of diversity and inclusion.
In her first post at GitHub, she worked on building recommendation engines targeting developers’ engagement in open source projects. With a long-time interest in cognitive science and computational thinking, the allure of working with a data set of millions of interacting programmers drew her to GitHub. In her new role, she is no longer narrowly focused on machine learning and data products. Instead, she has a view encircling the end-to-end experience of users on a platform that serves over 40 million users and provides critical infrastructure.
As part of her doctoral work, Omoju developed HipHopathy, a learning module in data science and natural language processing using rap lyrics. She wanted to give cultural relevance to introductory computing for young learners and show them how data science and programming could be used to explore the rich content in this artistic form. The module was included as part of the on edX MOOC, The Beauty and Joy of Computing, which launched in 2015 with over 20,000 learners. In her dissertation, she investigated how this learning module impacted student retention or attrition, particularly affecting historically under-represented students. Her work has deep implications for the design of inclusive computational science courses.
“Computation is a broad thing, and it has enough room to accommodate every single person. […] Computation applied to any field enhances that field and takes that field to the next level,” declared Omoju in her TEDx San Francisco talk entitled: “The myth of innate ability in tech.” She invites us all to be part of the new revolution, changing the world around us with AI and data science. And she quashes the myth of innate ability saying that it’s something invented to make the privileged feel better and as a way to justify the lack of representation of certain groups in the field.Her story of growth in the tech world is proof, from her early years in Nigeria, then coming to Memphis, Tennessee as a teenager and enrolling in an accounting degree, only to be gripped by fascination with the internet. After switching her major to computer science, she took a class on Expert Systems, and the rest is history. She tells the story in her blog post, #20YearsACoder.
I met Omoju while on my sabbatical stay at UC Berkeley — introduced by her advisor, Prof. Alice Agogino — and we had a memorable long lunch filled with conversation. We shared our common interest in computational thinking and widespread educational achievements via computing in context. I have since then witnessed her meteoric rise in the world of technology, and cannot wait to see how far she will continue to fly. With her humble attitude and profound thinking, I’m sure the JupyterCon community is in for a treat with her keynote.
Announcing keynote speakers and researching about them to write these features has been one of the joys of my role as the General Chair. I hope you enjoy reading about these wonderful people who will gift us with their time and thoughts!
The JupyterCon schedule of tutorials and talks is published. Join us!
Omoju Miller was originally published in Jupyter Blog on Medium, where people are continuing the conversation by highlighting and responding to this story.
It all started in April 2005 when freshman Min RK reached out to his physics professor, Brian Granger,
Dr. Granger, Talking to you this afternoon prompted me to put the rather vague idea I had into a less vague writing, so I thought I would send you a better explanation of the application I had in mind…
laying out his vision for an interactive development environment for computational physics. Reading this today, we can see how prescient that vision was, and included key elements of what Jupyter has become.
Min then joined Brian and Fernando in contributing to IPython and became one of the main driving forces behind a project that has grown to global prominence, with a lasting influence on the entire field of scientific computing.
The rest is history, Min has spent the following fifteen years contributing to IPython and Jupyter. We owe him some of the key components of the project such as JupyterHub. He was honored along with the rest of the Jupyter steering council with the 2017 ACM Software System Award.
Beyond Jupyter, he has contributed widely to open source software, especially in the scientific Python community. He helps maintain numerous scientific packages in the conda-forge package management system.
It is an honor for me to introduce Min's keynote! We hope you will join us at the conference and enjoy his talk. There are only a few days left and it is still time to sign up.
Benjamin Ragan-Kelley was originally published in Jupyter Blog on Medium, where people are continuing the conversation by highlighting and responding to this story.
Tema Okun has spent over 30 years working with and for organizations, schools, and community-based institutions as a trainer, facilitator, and coach focused on issues of racial justice and equity. Dr. Okun currently co-leads the Teaching for Equity Fellows Program at Duke University, which works with faculty seeking to develop stronger skills both teaching about race and racism and across lines of race, class, and gender. She also facilitates, coaches, and consults with leaders and organizations nationwide.
Tema was a member of the Educational Leadership faculty at National Louis University in Chicago and has taught undergraduate, master’s, and doctoral level students in educational leadership and education. She is the author of the award-winning The Emperor Has No Clothes: Teaching About Race and Racism to People Who Don’t Want to Know (2010, IAP) and the widely used article White Supremacy Culture. She publishes regularly on the pedagogy of racial and social justice.
Tema is a participant in the Living School for Action and Contemplation and a member of the Bhumisphara Sangha under the leadership of Lama Rod Owens. She is an artist, a poet, and a writer. She lives in Durham NC where she is fortunate to reside among beloved community. Her current project is deepening her ability to love her neighbor as herself. She is finding the instruction easy and the follow through challenging, given how we live in a culture that is afraid to help us do either or both.
Tema Okun at JupyterCon 2020
Three years ago, I was searching for career advice and discovered the Transform Your Workplace podcast with Brandon Laws and Megan Leatherman. I connected with Megan Leatherman and signed up for her newsletter. In Megan’s June 2020 newsletter, she included a reference to Tema’s podcast which really resonated with me.
The JupyterCon leadership had a vision for this conference to invite us to come together as a community, and think how we can make it better. We have strived to focus our attention on diversity and inclusion in all aspects of our programming. We also decided to accentuate equity and social justice in a dedicated keynote speech, and we are delighted to host Tema Okun in this role.
Tema Okun was originally published in Jupyter Blog on Medium, where people are continuing the conversation by highlighting and responding to this story.
From Paraview to Mayavi, there are multiple solutions for data analysis on 3D meshes on the desktop. Most of these tools provide high-level APIs that can be driven with a scripting language like Python. For example, one could control Paraview from a Jupyter Notebook. But this is not ideal as it relies on a desktop application for the rendering, which prevents using tools like MyBinder.
Nowadays, most scientists run their computation on the cloud, and they need tools for interacting and analyzing with their data.
There are already some solutions that are more integrated into Jupyter:
ipyvolume is a WebGL-based 3D plotting library for Jupyter. It has many features including multi-volume rendering.
K3D-jupyter helps you create 3D plots backed by WebGL with high-level API (surfaces, isosurfaces, voxels, mesh, cloud points, vtk objects, volume renderer, colormaps, etc).
itkwidgets is a tool for visualizing images, point sets, and meshes in 2D and 3D in Jupyter. It works by doing the rendering on the back-end and by streaming the frames to the front-end.
ipyvtk-simple is a Jupyter library for interfacing with any Python vtkRenderWindow. It relies on ipycanvas for streaming the frames to the front-end.
We needed a Paraview-like experience for Jupyter. We could provide this experience by relying on the vtk library in Python, but this means that every time you want to apply a new filter like warp-by-scalar, the Python back-end needs to send the filtered mesh to the front-end for display. This is far from ideal, as it might be hundreds of megabytes to download for every roundtrip to the back-end.
itkwidgets and ipyvtk-simple fix this issue by not sending the mesh to the page, instead, the rendering is done on the back-end and streamed to the user. This solution is, in a way, similar to using Paraview using a vnc solution. It works fine as long as you have a fast and low latency connection to the Jupyter server, and this solution scales properly with the mesh size, as the amount of data sent to the user is the same whether you analyze a fine or a coarse mesh.
Solutions like ipyvolume and K3D-jupyter can be backed by the Python vtk library (or by PyVista), but again, this means doing the mesh filtering in Python and sending the filtered meshes to the page for every change.
Today we are proud to announce ipygany! ipygany is a Jupyter widget that aims at bringing a Paraview-like experience to the webpage. With ipygany, you only send your mesh data to the front-end once, and effects such as mesh warping, contour computation, threshold filtering are directly done in the front-end and most-typically with the GPU.
Introducing ipygany
ipygany is a new interactive widgets library that allows you to visualize and analyze volumetric data in the Jupyter Notebook.
Whether your data comes from a VTK file or NumPy arrays, ipygany allows you to dynamically load your data, display them in the Notebook, and apply different kinds of visual effects on it.
ipygany provides a set of effects inspired by Paraview:
IsoColor: apply color-mapping to your mesh.
Warp: deform your mesh given a 3-D input data (e.g. displacement data on a beam)
WarpByScalar: deform your mesh given a 1-D input data (e.g. terrain elevation)
Threshold: only visualize mesh parts inside a range of data (e.g. 222 K≤ temperature ≤ 240 K)
IsoSurface: only visualize the surface where the mesh respects a data value (e.g. pressure == 3 bar)
Glyph effects like PointCloud
Water visualization
And there’s more to come!
Most of those effects are computed on the GPUonly! Which makes them really fast. For example, changing the deformation factor of the Warp effect only sends one floating-point number to the GPU, and the GPU will know how to re-render the mesh (using shaders) according to the new factor value, this update is virtually instantaneous. Changing the warp factor value is technically as fast as moving the camera position, it only requires rendering a new frame.
We strive to use efficient algorithms for better performances, especially for computation that cannot be done with the GPU.
WarpByScalar: completely computed on the GPU
Effects can be easily combined for highlighting important parts in your mesh. For example, you can easily cut your mesh using the Threshold effect then apply a Warp effect for visualizing a deformation on the result.
Combining a Threshold with a Warp
All those effects are interactive widgets, they are stateful objects that you can dynamically update from Python or using widgets like sliders, text inputs, etc.
Your mesh is also an interactive widget: you can dynamically update your data, which is very useful when your data changes through time.
Visualizing an animation from two viewpoints
If you work with fluid dynamics, we even provide refractive/reflective effects and water caustics computation for nice looking visualization:
If you do Water simulation, ipygany also allows you to render you water with reflective/refractive effects and it even computes light caustics!
My name is Martin Renou, I am a Scientific Software Engineer at QuantStack. Before joining QuantStack, I studied at the aerospace engineering school SUPAERO in Toulouse, France. I also worked at Logilab in Paris, France and Enthought in Cambridge, UK. As an open-source developer at QuantStack, I work on a variety of projects, from xtensor and xeus-python in C++ to ipyleaflet and bqplot in Python and Javascript/TypeScript.
In this blog post, we will introduce the Elyracode snippet extension, which enables us to reuse arbitrary snippets of code in your notebooks, source code, or markdown files in JupyterLab.
Let’s say you are working on a notebook and want to include a standard header or footer (like licensing text) or some code that you’ve previously created. This typically results in a hectic search. In which notebook did I use the code? Where’s the most current version of the disclaimer I need to add? While maintaining a “scratchpad” might help, native support for reusable code or documentation assets in JupyterLab holds a lot more appeal.
Code snippet ui
Installing the code snippet extension
The code snippet extension can be installed as part of Elyra or individually using pip or conda. In the context of this article, see below how to install the code snippet extension in your existing JupyterLab deployment.
Code snippets are accessed by opening the code snippets tab on the JupyterLab sidebar:
The code snippets UI is divided into two parts:
a quick search panel, and
the code snippet list, providing access to code snippet specific actions, such as copy, insert, edit, and delete.
Creating a snippet
To create a snippet click + above the search bar and provide the required information. You can optionally tag snippets to make them more easily discoverable.
Finding a snippet
To locate a code snippet, enter a search term and/or pick one of the listed tags.
Copying a snippet to the clipboard
You copy the snippet content to the clipboard by clicking the snippet’s copy icon.
Inserting a snippet
Click the snippet’s insert icon to paste the snippet content in the desired destination, such as a cell in a notebook or an open editor window. Drag-and-Drop of the snippet has also been incorporated in the latest Elyra release.
Do note that the editor does not keep track of where you’ve inserted a snippet. Also, note that snippets don’t act like macros and changes to a snippet are therefore not reflected in the locations where the snippet was embedded.
Editing a snippet
You edit a snippet by clicking the snippet’s pencil icon.
Deleting a code snippet
You delete a code snippet by clicking the snippet’s trash icon.
Sharing code snippets
The code snippet extension currently doesn’t provide any import or export capabilities. However, you can access the relevant metadata files that contain the definitions.
The definitions are stored in the $JUPYTER_DATA_DIR/metadata/code-snippets directory, where $JUPYTER_DATA_DIR refers to the Jupyter data directory, which you can identify by running the following command in a terminal window:
$ jupyter --data-dir
In my environment, the code snippets are stored in /Users/ptitzler/Library/Jupyter/metadata/code-snippets/. To back up or share my snippets, I typically create an archive from the content of this directory.
Try Code Snippet from Binder
To experiment with the code snippet extension without installing it locally, just click on the binder link below and then look for the code-snippet icon on the JupyterLab side-bar :
Elyra is constantly making Jupyter Notebooks better aiming to help data scientists, machine learning engineers, and AI developers through the model development life cycle complexities, making JupyterLab even better for AI practitioners.
Come and join our weekly dev meetings to learn more about the most recent updates to Elyra and to ask your questions to the community, including the project core developers.
We would also appreciate for you to get involved with the Elyra project. Read our contributing guidelines, create new issues if you have questions, suggestions for new features, or to report any bugs. We also welcome contributions via GitHub pull requests. And last but not least, don't forget to star the project on Github.
Last month at JupyterCon’s final keynote, we proudly announced the recipients of the Jupyter Distinguished Contributor (JDC) award for the special election of our inaugural cohort of contributors.
Project Jupyter Distinguished Contributors are recognized for their substantial contributions to Jupyter itself in both quality and quantity over at least two years. Contributions may include code, code review, infrastructure work, mailing list and chat participation, community help/building, education and outreach, fundraising, branding, marketing, inclusion and diversity, UX design and research, etc.
Please congratulate the winners of the inaugural cohort of Jupyter Distinguished Contributors!
Cameron Oelsen and Chris HoldgrafDouglas Blank and Erik SundellGeorgiana Dolocan and Grant NestorIan Rose and Kevin BatesLindsey Heagy and Lorena BarbaLuciano Resende and Matthew SealNicholas Bollweg and Safia AbdallaSaul Shanabrook and Tim HeadTony Fast and Vidar FauskeYuvi Panda and Zach Sailer
In closing, we’d like to offer a special thanks to Bloomberg and Amazon Web Services who were financial sponsors of this first group of Jupyter Distinguished Contributors.
In this post, we present the first public release of XVega, a C++ library for producing Vega-Lite charts.
Data science workflows differ from traditional software development in that engineers make use of available tools to explore and reason about a problem. In such exploratory work, engineers load data, crunch numbers, produce simple visualizations and iterate… Progress happens in quick incremental iterations, which is possible when tooling does not get in the way.
This kind of interactive computing is generally associated with the Python or R programming languages. However, with the advent of the Cling C++ interpreter from CERN, and the subsequent development of the xeus-cling Jupyter kernel, new possibilities have opened up in this space.
The Jupyter stack — that started in the scientific Python community has evolved into a language-agnostic framework that can now be leveraged by C++ developers. It bridges the gap between the countless scientific computing libraries and tools available in C++ and the Jupyter ecosystem.
The scientific C++ stack now has numerous projects under its belt — such as xtensor, xframe, etc. However, there is little support for visualization — especially for interactive plots. While there exist matplotlib-cpp and matplotplusplus (with their plotting API resembling the original matplotlib library) — they suffer from the same cons as the original library does (such as the imperative API and the confusion between dual object-oriented and state-based interface).
Owing to all these shortcomings, along with the observation that JupyterLab comes with existing support for Vega and Vega-Lite Charts (through the application/vnd.vegalite.v3+json MIME type), one can leverage this support to bridge the gap rather than reinvent the wheel. Apart from standalone use — one could also integrate such a system into other projects such as xeus-SQLite.
The main idea is to programmatically fill in a JSON that conforms to the Vega-Lite specification and respects the notion of grammar of graphics. It is analogous to what Altair did for Python. We will expose different APIs responsible for filling in certain parts of the JSON.
The fundamentals with XVega are still the same, i.e. the three essential elements of a Chart are Data, Marks and Encodings as usual and importing the library is as simple as writing two statements:
#include "xvega/xvega.hpp"
using namespace xv;
The experience is similar to what Altair offers and, hence, the central piece to the library is the Chart() object — which knows how to emit the JSON dictionary representing the data and visualization encodings.
For those unfamiliar with the Vega ecosystem, a quick recap for the above terms is given below:
Marks — What graphic should represent the data?
Encodings — Mapping between Data and Visual Elements of the Chart (such as x-axis, etc.).
Basic usage of XVega showcasing the essential elements — Data, Marks and Encodings.
The core strength of using such a system is the separation of specification and execution. The declarative API makes it easy to specify “what” should be done rather than focus on incidental details of the “how”. It means that rather than having a special “hist()” function for plotting a histogram, passing “bin=True” does the job.
Simply stating bin=True bins the x-axis giving us the Histogram directly — without using a dedicated function.
We can of-course customize the binning parameters with a “Bin()” object instead. And while we are doing that, let’s add a colour encoding as well to get a sense of the 3rd dimension.
More control can be achieved using a custom Bin() object — used to set the binning parameters.
Another plus of using Vega-Lite as a backend is the possibility of using transformations within the specification rather than doing it before. (E.g., one can do linear regression as a part of this declarative API).
Usage of layering and transformations in XVega.
Lastly, support for Interactions and Selections is a no-brainer. It’s as simple as defining what to use and adding it to the Chart() object.
Zooming and Panning along with Tooltips using Interval Selection in XVega
Developing such a system for C++ comes with its own challenges and to provide a seamless experience like Altair, several things are needed to be taken care of:
Multiple types for a single entity: the Vega-Lite specification allows variables of different kinds (such as a boolean type and an integer type may be equally valid for a particular property). Variants and Visitors in C++ allow us to achieve this.
Out of order keyword arguments: Method chaining is the classical approach to tackle out-of-order keyword arguments in C++ and is what is used in XVega indeed.
Optional fields: A lot of values in the Vega-Lite specification are optional, and this is made possible by the optionally contained values in C++ (i.e. using std::optional).
XVega is still at an early stage and under active development. We are currently working on integrating it with the xeus-sqlite and other SQL Jupyter kernels to enable the visualization from SQL queries. We are also working on improving the compilation time of XVega with Cling.
It is an exciting time for the interactive C++ ecosystem, as so much innovation is happening in the Cling and Jupyter projects. There is a lot more to come for sure. If you are interested in helping us build that future, come talk to us at Gitter and GitHub.
About the Author
My name is Madhur Tandon, and I currently work with QuantStack as a Scientific Software Engineer. Before joining QuantStack, I have worked with Mozilla, Deepnote, INCF (International Neuroinformatics Coordinating Facility), TCS Research and Elucidata. I have also been a speaker at JupyterCon 2020 and PyData Delhi 2017 and 2018. I graduated from IIIT-Delhi this year with a Bachelor’s degree in Computer Science with Honors. Besides core Data Science and Machine Learning, I am interested in tools that enable and enhance data scientists’ workflow and experience.
A C++ backend for Vega-Lite was originally published in Jupyter Blog on Medium, where people are continuing the conversation by highlighting and responding to this story.
The purpose of this survey is to gather information from the community in order to enable data-driven decision making about the future of JupyterLab.
The content of the survey focuses on the following categories:
Use Cases — who are they, what are their usage patterns, and what are they doing?
Tooling — what type of data & tools are they using for data science, and what are their pain points in doing so?
By participating in this survey, end-users will guide the roadmap of JupyterLab toward their use cases. Even if you don’t use Jupyter, your input is welcome (see initial questions).
Please share with your teams and friends.
Thank you.
Survey — JupyterLab and beyond was originally published in Jupyter Blog on Medium, where people are continuing the conversation by highlighting and responding to this story.